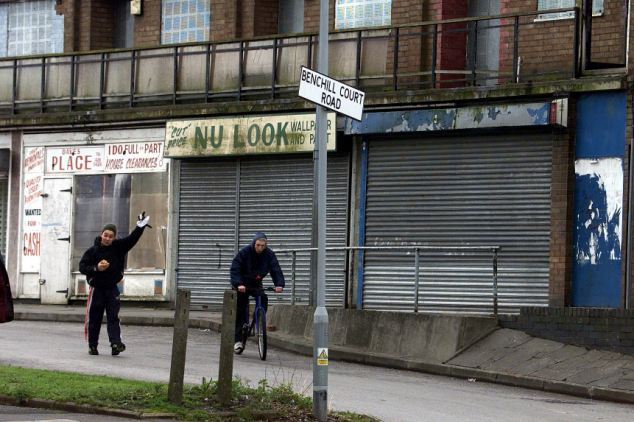
In March 2015 the Joseph Rowntree Foundation (JRF) published a report which details how between 2010 and 2015 the poorest communities in England shouldered the biggest burden of the public sector austerity cuts.
Overall, local authorities have seen their spending power reduced by 27% in real terms. Planning and ‘supporting people’ services have seen cuts of 45%. Behind these figures lies inequality between the most and least deprived areas. On the one hand social care spending (this combines children and adult services) has risen in real terms in the least deprived areas to the tune of £28 per head. Conversely, social care spending has fallen by £65 per head in the more deprived areas. Respectively, these figures represent an 8% rise and a 14% fall. The most deprived all-purpose authorities – those authorities which provide the full set of local authority services – saw cuts of £220 per head. In contrast, the least deprived all-purpose authorities saw cuts of £40 per head. Newcastle, with 37% of its population within the most deprived 10% of areas in England, experienced a 22% cut in funding. On the other hand, Milton Keynes, with 11% of its population within the most deprived 20% of areas, experienced a 13% cut. The result of the faster rate of cuts for the more deprived authorities has been a convergence in the overall spending per head between the most and least deprived authorities. The differential was 45% in 2010/11. It was 17% in 2014/15.
Add to these figures that 62% of council expenditure is spent on services used more by the poor (eg. adult social care, children’s social care, home care, homelessness services and public transport) compared to 2% spent on services used mostly by the better off (eg. museums and galleries, parking, planning and adult education) it is clear the poorest households with the greatest need for public services are bearing the biggest burden of the cuts. The Institute of Fiscal Studies has indicated that the cuts which will follow the election will be at least as big as those already experienced. The JRF warn that in the next period social work and social care services are particularly vulnerable to further cuts.
The poorest have additionally been paying with shorter and more miserable lives. The latest figures from the Office for National Statistics (ONS) show on average men in the most deprived areas live 9 years less than men in the least deprived areas. For women the difference is 6.9 years. In addition men in the most deprived areas can expect to live 52.2 years in good health; 18.3 years less than men in the least deprived areas, who can expect to live 70.5 years in good health. The figure for women is 18.9 years less than men; with women in the least deprived areas having a healthy life expectancy of 71.3 years compared to 52.4 years for women in the most deprived areas.
Such health inequality was already in existence under the last Labour government. The National Cancer Intelligence Network has shown that, between 2007 and 2011, if the more deprived had the same experience as the least deprived, there would have been nearly 15,300 fewer newly diagnosed cases of cancer annually. Similarly, annually nearly 19,200 would not have died from cancer. In the one cancer, breast cancer, that struck the least deprived more readily, it was still the case that the more deprived who contracted it were more likely to die. Such inequality stretches back to 1997. Labour’s approach to such inequality was to show concern via ‘programmes for action’ and point to the need to improve the social and economic determinants of poor health. In reality the poor were blamed for their poor health and the wealth divisions, at the root of health inequality, fostered. Under the Coalition health inequality has effectively just been dropped from the agenda. Even the mildly critical King’s Fund has pointed out that such initiatives as Public Health England’s ‘national conversation’ on health inequality was launched four years after the Coalition came to power and has amounted to no more than one event of 100 people and conversations with 19 public health stakeholders and 87 members of the public. There has been the publication of an inevitable strategy document (three and a half years after coming to power) and the launch of a health premium incentive scheme which has amounted to nothing more than the sharing of £5m between 152 local authorities.
This neglect and the inequality in the distribution of wealth and welfare resources has combined to produce situations such as that revealed by the ONS that in 2012 the top ten Clinical Commissioning Groups (CCGs) with the highest health life expectancy were clustered in the wealthy areas to the south and west of London. The CCGs with the lowest healthy life expectancy were located in the poorer areas of the north, the midlands and east London. The NHS Guildford and Waverley had the highest healthy life expectancy of around 71 years, and NHS Bradford City the lowest healthy life expectancy of around 52 years.


